I found the post interesting part of the Data Visualization video to be when he said that "people are using visualization today to do something". This stuck out to me because data is a huge aspect of life today. Almost everything we do has a system of data. The video also went on to talk about how the creator can have a different reason for creating the data visualization than how the view is going to perceive it.
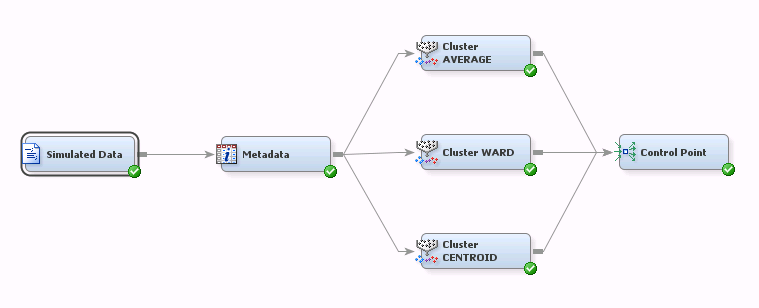
I was able to relate this video to a class I took last semester called Data Mining. Our final assignment was to take this massive amount of data on SAS and choose key variables to analyze. The data was on a grocery store and its various locations throughout the United States. You may never think that your local grocery store is processing data, but in fact it is taking into account many things you are doing while there. These include: scanning items, which brands people are buying the most, how much money is being spent, what type of payment is being used...etc. From there we created a data visualization on the variables we felt were most important to the store in order to better their profits.
Below is a picture of what the data visualization I described above can look like:
It is interesting to think that data can be used with almost anything, but it is also important how it is presented as well. The video also referred to data visualization as creating a story. This also stuck with me because if there isn't a clear objective or narrative then it will not make any sense to the viewer. Just how typical artwork conveys a message, so does data but just in the form of numbers, shapes, lines etc that all connect into a story about the particular subject.
No comments:
Post a Comment